Image Details
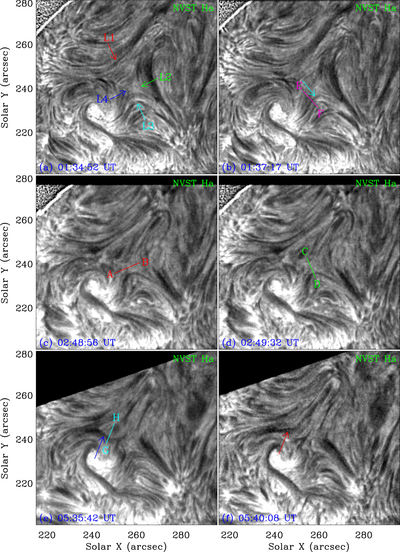
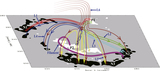
Caption: Figure 2.
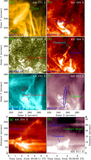
Magnetic reconnection between Hα fibrils observed by NVST. (a)–(f) NVST Hα images. The red, green, cyan, and blue arrows separately denote the fibrils L1, L2, L3, and L4. The red, green, pink, and cyan lines AB, CD, EF, and GH in (c), (d), (b), and (e) show the positions for time slices of NVST Hα images displayed in Figures 3(a)–(d), respectively. The FOV is denoted by the red rectangle in Figure 1(a). An animation of the unannotated NVST Hα images is available. It covers ∼5.3 hr starting at 01:20:44 UT, and the video cadence is 12 s. See Section 3.1 for details.
(An animation of this figure is available.)
The video/animation of this figure is available in the online journal.
Other Images in This Article
Copyright and Terms & Conditions
© 2021. The American Astronomical Society. All rights reserved.