Image Details
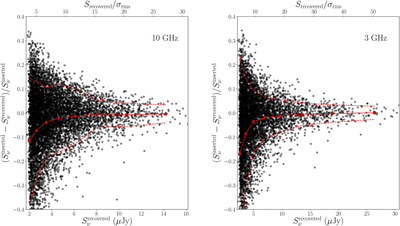
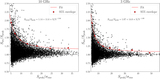
Caption: Figure 7.
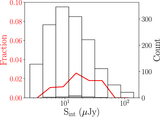
Simulated ratio of (inserted flux density – recovered flux density) to inserted flux density as a function of recovered flux density. The left panel shows the distribution for the 10 GHz image, and the right panel shows the distribution for the 3 GHz image. The solid red line denotes the median of eight logarithmic bins (indicated by the red points) across the flux density range, and the dashed lines mark the 1σ upper and lower bounds in those bins. The effect of flux boosting at the faint end is illustrated by the rapid downturn below about 3 μJy for 10 and 3 GHz.
Other Images in This Article
Show More
Copyright and Terms & Conditions
© 2021. The American Astronomical Society. All rights reserved.
Copyright ©
2025 Astronomy Image Explorer. All Rights Reserved.