Image Details
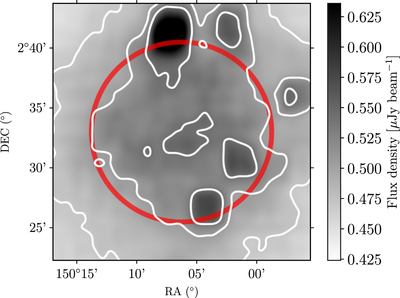
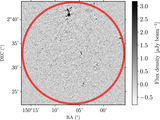
Caption: Figure 4.
The rms map of the 3 GHz observation before primary beam correction. The image size is ﹩460\,{\mathrm{arcmin}}^{2}﹩. The rms map is created with PyBDSF. The red circle indicates the HPBW of the primary beam at 3 GHz, which corresponds to ﹩{15}^{{\prime} }﹩. The gray scale shows the rms noise from 0.8σ to 1.2σ, where σ = 0.53 μJy beam−1. The contours are plotted at [0.47, 0.51, 0.54] μJy beam−1.
Other Images in This Article
Show More
Copyright and Terms & Conditions
© 2021. The American Astronomical Society. All rights reserved.
Copyright ©
2025 Astronomy Image Explorer. All Rights Reserved.