Image Details
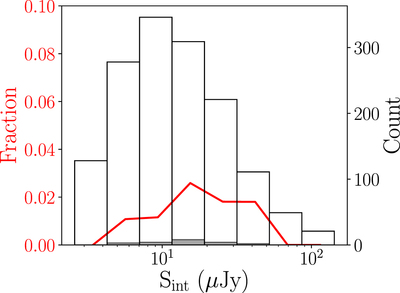
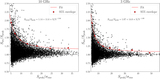
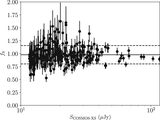
Caption: Figure 10.
Fraction of false detections (red line) as a function of flux density. The open (filled) histogram shows the number of components cataloged in the observed 3 GHz map (detected in the inverted map). These data are also listed in Table 4. The false-detection rate is always smaller than 3% and is 1% overall.
Other Images in This Article
Show More
Copyright and Terms & Conditions
© 2021. The American Astronomical Society. All rights reserved.
Copyright ©
2025 Astronomy Image Explorer. All Rights Reserved.