Image Details
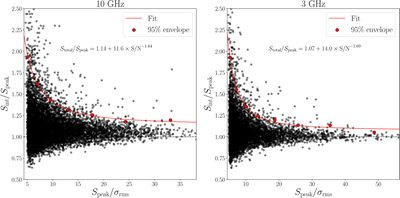
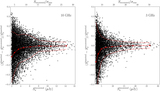
Caption: Figure 6.
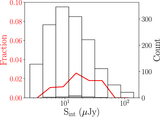
Simulated ratio of integrated flux density to peak brightness as a function of S/N for unresolved sources from the 200 Monte Carlo simulations for the 10 (left) and 3 (right) GHz images. For logarithmic bins in S/N, the red points show the threshold below which 95% of the sources lie in that bin. The red line shows the fit to this upper envelope. Applying these thresholds to the real data, we find that, respectively, 13% and 32% of the sources are resolved.
Other Images in This Article
Show More
Copyright and Terms & Conditions
© 2021. The American Astronomical Society. All rights reserved.
Copyright ©
2025 Astronomy Image Explorer. All Rights Reserved.