Image Details
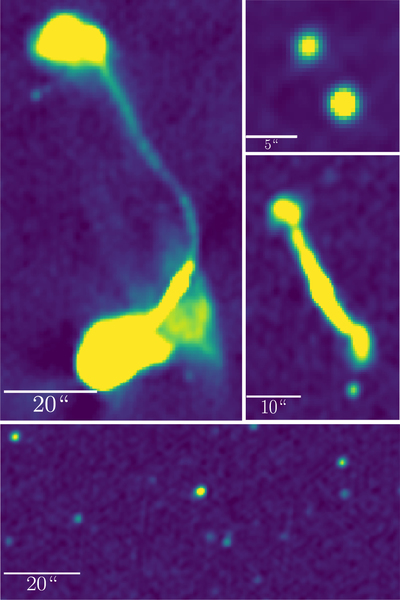
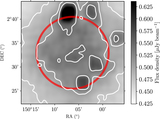
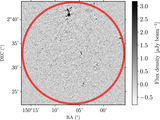
Caption: Figure 17.
Stamps from the 3 GHz continuum map showing examples of extended (left and lower right), multicomponent (upper right), and compact (lower) radio sources. The color scale shows the flux density from −3σlocal to 50σlocal, where σlocal is the local rms noise.
Other Images in This Article
Show More
Copyright and Terms & Conditions
© 2021. The American Astronomical Society. All rights reserved.
Copyright ©
2025 Astronomy Image Explorer. All Rights Reserved.