Image Details
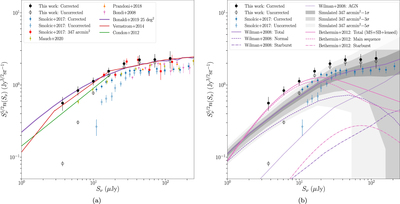
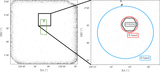
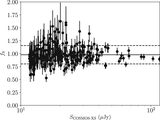
Caption: Figure 15.
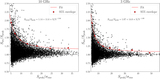
Euclidean-normalized radio source counts at 3 GHz (filled black circles). Open black circles show the source counts without corrections. Error bars correspond to the Poisson error for the uncorrected points. For the corrected points, the errors are propagated from the errors on the correction factors and the Poisson errors on the raw counts per bin. Corrected (filled) and uncorrected (open) VLA-COSMOS 3 GHz measurements from Smolčić et al. (2017b) are shown with blue points. Panel (a) also shows the number counts from P(D) analysis by Condon et al. (2012; green line) and Vernstrom et al. (2014; red line). The purple line shows the results from the simulation of Bonaldi et al. (2019). The red filled squares show the source counts for sources in the Smolčić et al. (2017b) catalog within the area of our pointing. Panel (a) also shows the results from 1.4 GHz observations from Bondi et al. (2008; filled pink downward triangles) and Prandoni et al. (2018; filled orange upward triangles) and 1.28 GHz observations from Mauch et al. (2020; filled olive diamonds). The flux densities are shifted to the 3 GHz observed frame using a spectral index of −0.84. Panel (b) shows the comparison to the number counts from the simulation of Wilman et al. (2008; purple lines) and Béthermin et al. (2012; pink lines). Different line styles correspond to different source types as defined in the legend. The solid lines show the total source counts. The shaded regions demonstrate the effect of cosmic variance and correspond to 1, 3, and 5 standard deviations in the source count measurements of the simulations by Wilman et al. (2008).
Other Images in This Article
Show More
Copyright and Terms & Conditions
© 2021. The American Astronomical Society. All rights reserved.