Image Details
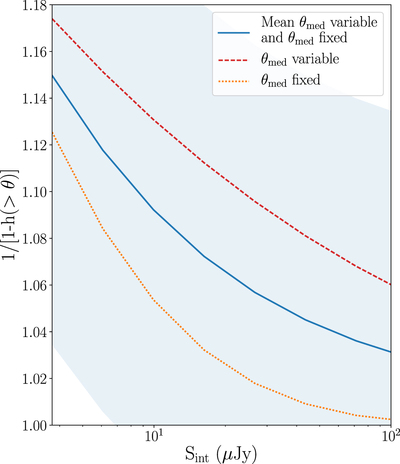
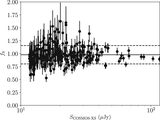
Caption: Figure 14.
Resolution bias correction ﹩1/[1-h(\gt {\theta }_{\max })]﹩ for the fraction of sources with angular size larger than ﹩{\theta }_{\max }﹩ at a given integrated flux density at 3 GHz. For the faintest sources, three curves are shown: the red dashed curve shows θmed as a function of Sint, the orange dotted curve shows the result assuming θmed = 0.″35 at these flux densities, and the blue solid curve shows the mean of the two curves. The range reflects the assumed 10% uncertainty following Windhorst et al. (1990). The resolution bias correction is found to be 1.15 for the lowest flux bin.
Other Images in This Article
Show More
Copyright and Terms & Conditions
© 2021. The American Astronomical Society. All rights reserved.
Copyright ©
2025 Astronomy Image Explorer. All Rights Reserved.