Image Details
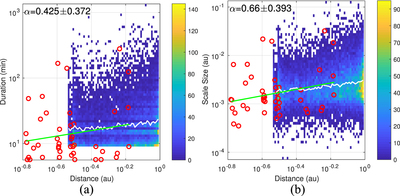
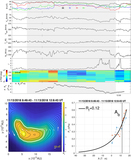
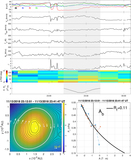
Caption: Figure 6.
Distribution of SFR properties with the radial distances r: (a) duration and (b) scale size, derived for each SFR. Results via the Helios data set are presented by the 2D histograms. The bin grids are 60 × 60 in size. All individual records via PSP are directly plotted by red circles. The white curve represents the average value of each bin in r, and event count is indicated by the color bar. The green line is a power-law fitting curve for the respective PSP points with the corresponding power-law exponent α denoted on top.
Other Images in This Article
Copyright and Terms & Conditions
© 2020. The American Astronomical Society. All rights reserved.
Copyright ©
2025 Astronomy Image Explorer. All Rights Reserved.