Image Details
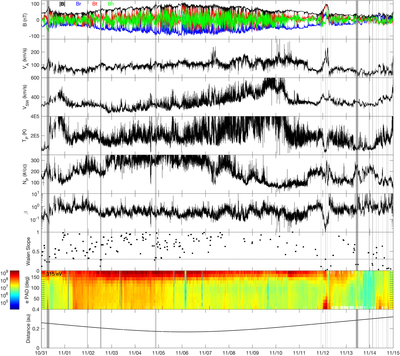
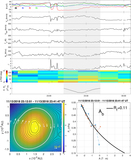
Caption: Figure 1.
Time-series plot from 2018 October 31 to November 15. From top to the bottom the panels are the magnetic field magnitude and components in the RTN coordinates, the Alfvén speed, the solar wind speed, the proton temperature, the proton number density, the proton β, the Walén test slope for each SFR candidate, the electron pitch angle distribution (PAD) for the 315 eV energy channel, and the PSP radial distance in au. In the seventh panel, the Walén slope threshold 0.3 is denoted by the horizontal dotted–dashed line. Across all panels, the identified SFR intervals are marked by gray shaded areas.
Other Images in This Article
Copyright and Terms & Conditions
© 2020. The American Astronomical Society. All rights reserved.
Copyright ©
2025 Astronomy Image Explorer. All Rights Reserved.