Image Details
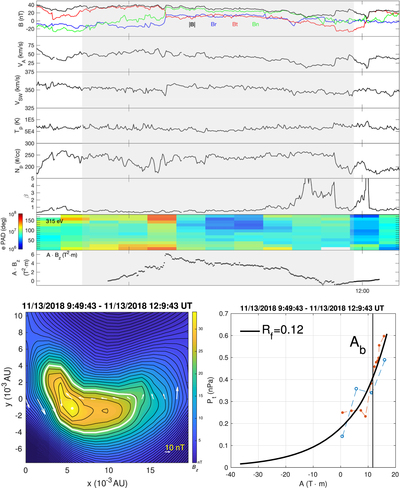
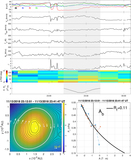
Caption: Figure 4.
Time-series plot and GS reconstruction result of SFR No. 15, 2018 November 13, 9:49:43–12:09:43 UT. The flux-rope interval is enclosed by the gray block. From the top to the sixth panels: time-series data; the format follows that of Figure 1. The seventh and eighth panels show the electron PAD and the product of the magnetic flux function A and the axial magnetic field Bz, respectively. The bottom left panel is the standard cross-section map from the GS reconstruction with ﹩\hat{{\boldsymbol{z}}}=[0.087,0.492,0.866]﹩ in the RTN coordinates. The color represents Bz as indicated by the color bar, while the black contours represent the transverse field lines. The spacecraft path is along the line y = 0, with the measured transverse field vectors marked by the white arrows. The bottom right panel is the Pt(A) plot: the blue circles, red dots, and the black line represent the measured data points along the spacecraft path from the observations, as well as the fitting curve with the fitting residue Rf as denoted, respectively. The vertical line denoted by Ab marks the magnetic flux function value corresponding to the white contour line in the bottom left panel.
Other Images in This Article
Copyright and Terms & Conditions
© 2020. The American Astronomical Society. All rights reserved.