Image Details
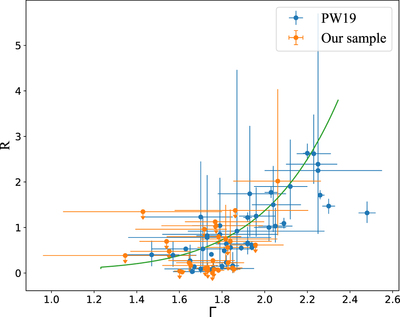
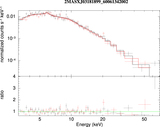
Caption: Figure 9.
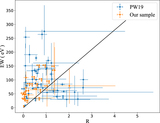
The Γ vs. reflection factor R of our sample and PW19. The green line shows the expected R vs. Γ curve based on the model in Beloborodov (1999), which is a result of the relative motion of the outflowing corona with respect to the disk.
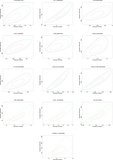
Other Images in This Article

Copyright and Terms & Conditions
© 2020. The American Astronomical Society. All rights reserved.
Copyright ©
2025 Astronomy Image Explorer. All Rights Reserved.