Image Details
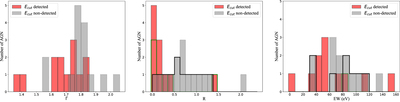
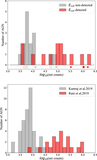
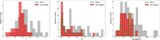
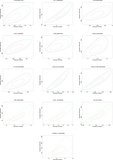
Caption: Figure 5.
Distribution of the spectral parameters of our sources with and without Ecut detections. In the middle and right panels, there are a number of sources with upper limits to R or EW. These sources are marked with green (for Ecut detections) and black (for Ecut nondetections) lines, respectively.
Other Images in This Article

Copyright and Terms & Conditions
© 2020. The American Astronomical Society. All rights reserved.
Copyright ©
2025 Astronomy Image Explorer. All Rights Reserved.