Image Details
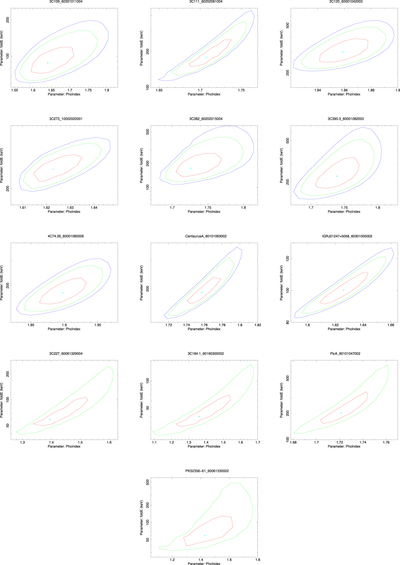
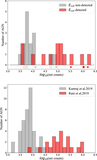
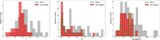
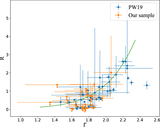
Caption: Figure C1.
Contour plots of Γ vs. Ecut of sources with Ecut detected. For sources with multiple observations, the best-constrained one is plotted. Red, green, and blue represent 1σ, 90%, and 2σ (when available) confidence levels, respectively.
Other Images in This Article

Copyright and Terms & Conditions
© 2020. The American Astronomical Society. All rights reserved.
Copyright ©
2025 Astronomy Image Explorer. All Rights Reserved.