Image Details
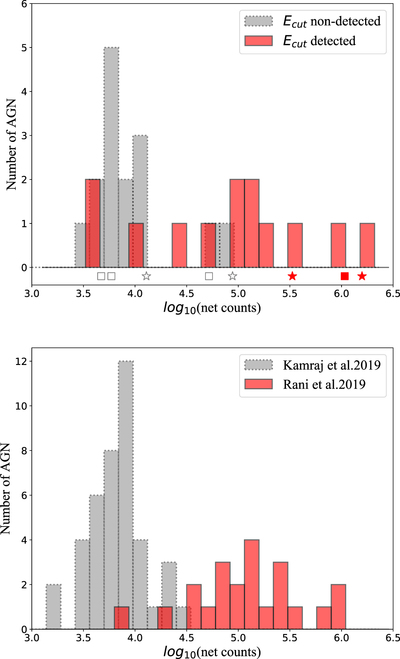
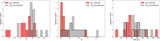
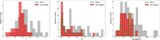
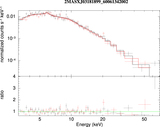
Caption: Figure 4.
Distribution of (FPMA+FPMB) net counts for Ecut detections and nondetections. Upper panel: our radio galaxy sample. The four FR I and four core-dominated galaxies are marked with stars and squares, respectively. Lower panel: the Ecut nondetected sample in Kamraj et al. (2018) and the Ecut-detected sample in Rani et al. (2019).
Other Images in This Article

Copyright and Terms & Conditions
© 2020. The American Astronomical Society. All rights reserved.
Copyright ©
2025 Astronomy Image Explorer. All Rights Reserved.