Image Details
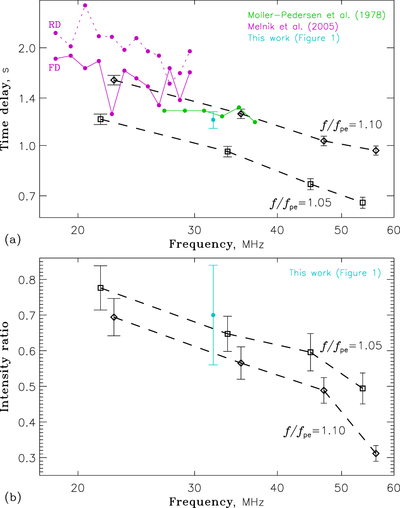
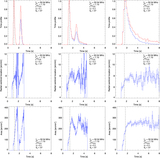
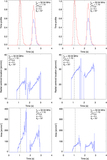
Caption: Figure 7.
Parameters of drift-pair bursts versus emission frequency. (a) Time delay between the burst components. (b) Relative intensity of the second component. Black lines show the simulation results for an emission source located at longitude θ0 = 10°, ϵ = 0.8, α = 0.1, and initial emission to plasma frequency ratios ﹩f/{f}_{\mathrm{pe}}({r}_{0})=1.05﹩ and 1.10 (marked by ﹩\square ﹩ and ﹩\diamond ﹩ symbols, respectively). The observations are plotted as indicated by the legend. Error bars represent one standard deviation.
Other Images in This Article
Copyright and Terms & Conditions
© 2020. The Author(s). Published by the American Astronomical Society.
Copyright ©
2025 Astronomy Image Explorer. All Rights Reserved.