Image Details
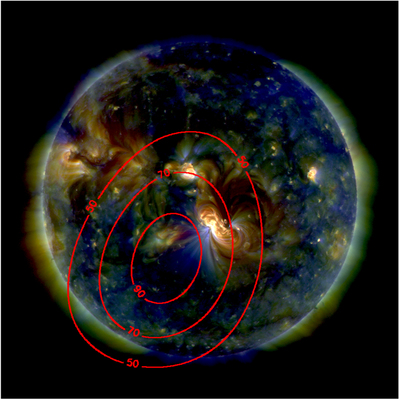
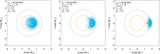
Caption: Figure 2.
LOFAR radio map (intensity contours drawn at the levels of 50%, 70%, and 90% of the maximum intensity) overplotted on the combined SDO/AIA EUV image. The radio map corresponds to the frequency of 32 MHz and time of 08:51:23.55 UT (the first peak of the burst shown in Figure 1). The background EUV map includes the SDO/AIA images at 211 Å (red), 193 Å (green), and 171 Å (blue).
Other Images in This Article
Copyright and Terms & Conditions
© 2020. The Author(s). Published by the American Astronomical Society.
Copyright ©
2025 Astronomy Image Explorer. All Rights Reserved.