Image Details
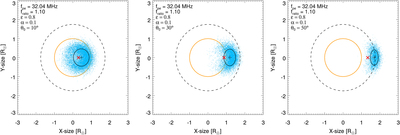
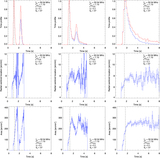
Caption: Figure 6.
Simulated radio images for emission at f = 35.2 MHz, ﹩f/{f}_{\mathrm{pe}}({r}_{0})=1.10﹩, a density fluctuation level ϵ = 0.8, a level of anisotropy α = 0.1, and an emission source located at longitudes θ0 = 10°, 30°, and 50°. Each dot represents one photon. The projected position of the true radio source and the apparent source centroid are shown by the red (×) and black (+) crosses, respectively. The black ellipse shows the source area at the half-maximum level. The orange circle denotes the solar limb, and the dashed circle denotes the level where the true source is located.
Other Images in This Article
Copyright and Terms & Conditions
© 2020. The Author(s). Published by the American Astronomical Society.
Copyright ©
2025 Astronomy Image Explorer. All Rights Reserved.