Image Details
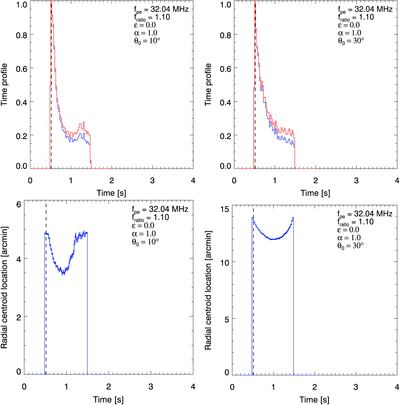
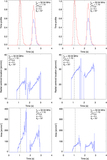
Caption: Figure 3.
Simulated time profiles without plasma density fluctuations (ϵ = 0) for an emission at f = 35.2 MHz, with ﹩f/{f}_{\mathrm{pe}}({r}_{0})=1.10﹩, and emission sources located at θ0 = 10° (left column) and θ0 = 30° (right column). Top row: the radio flux (normalized by the maximum value), where the blue and red lines represent the signal with and without collisional absorption, respectively. Bottom row: the apparent radio source position (distance from the solar disk center), where error bars represent one standard deviation.
Other Images in This Article
Copyright and Terms & Conditions
© 2020. The Author(s). Published by the American Astronomical Society.
Copyright ©
2025 Astronomy Image Explorer. All Rights Reserved.