Image Details
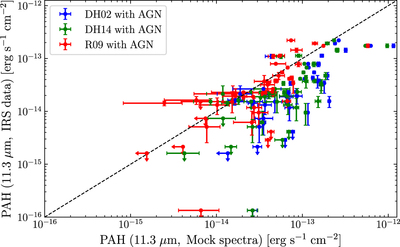
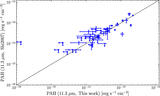
Caption: Figure 12.
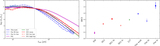
The 11.3 μm PAH fluxes of our mock spectra vs. those of the observed IRS data. The red, blue, and green dots are for the R09, DH02, and DH14 libraries. The dashed line indicates the one-to-one relation. Among the three galaxy template libraries, the R09 PAH emission is roughly consistent with observations. For the DH02 and DH14 libraries, the PAH emission is overestimated. This is likely due to the fact that the silicate absorption feature is not properly modeled in these two libraries.
Other Images in This Article
Show More
Copyright and Terms & Conditions
© 2020. The American Astronomical Society. All rights reserved.
Copyright ©
2025 Astronomy Image Explorer. All Rights Reserved.