Image Details
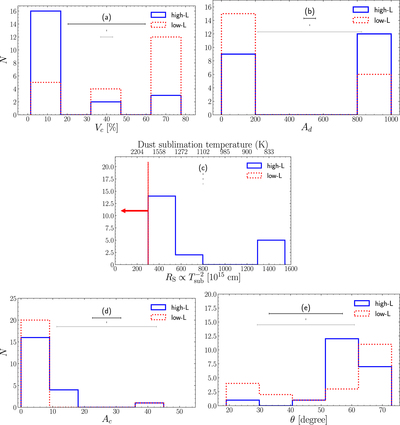
Caption: Figure 8.
Comparison of the distributions of Vc, Ad, Rs, Ac and θ for the high-luminosity subsample (blue histograms) and low-luminosity subsample (red histograms). The distribution of Ad shows a gap between 200 and 800, which might be caused by the large gap in the parameter space of Ad (see Table 1) in the model of Siebenmorgen et al. (2015). High-luminosity AGNs tend to have larger midplane optical depths (Ad), smaller cloud filling factors (Vc), and larger inner radii (Rs; which indicates colder dust sublimation temperature). Interestingly, the low-luminosity AGNs seem to prefer Rs values that hit the lower bound of the allowed Rs space. The distributions of Ac (or θ) for the two subsamples are statistically indistinguishable given p > 0.05 from the Anderson–Darling tests. In each panel, the three horizontal lines from bottom to top show the corresponding error bars of the three representative sources with the 25th/50th/75th percentile luminosities in our final sample, respectively. Some parameters have zero error bars; this is because the parameter space of the torus model is too sparse to infer the 1σ errors, i.e., the 1σ errors are smaller than the step sizes of the parameters (see Table 1). The leftward red arrow in panel (c) indicates the trend of RS for the low-luminosity subsample if the RS parameter space can reach smaller values.
Other Images in This Article
Show More
Copyright and Terms & Conditions
© 2020. The American Astronomical Society. All rights reserved.