Image Details
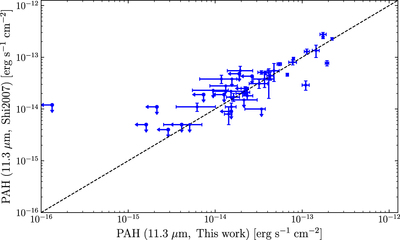
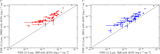
Caption: Figure 9.
Comparison of 11.3 μm PAH flux measurements of the observed IRS data between our work and Shi et al. (2007). Error bars indicate the 25th and 75th percentiles; upper limits correspond to the 90th percentiles. The dashed line indicates the one-to-one relation. There is no significant systematic offset between the two sets of measurements.
Other Images in This Article
Show More
Copyright and Terms & Conditions
© 2020. The American Astronomical Society. All rights reserved.
Copyright ©
2025 Astronomy Image Explorer. All Rights Reserved.