Image Details
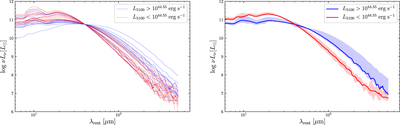
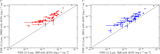
Caption: Figure 7.
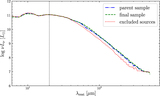
AGN SEDs for our high- and low-luminosity subsamples. Left panel: blue (red) dotted curves represent AGN SEDs of sources with L5100 greater (less) than the median L5100 (﹩{10}^{44.55}\,\mathrm{erg}\,{{\rm{s}}}^{-1}﹩). Right panel: the blue and red solid curves represent the median SEDs of the high- and low-luminosity AGN subsamples, respectively. Shaded regions are the 1σ uncertainties derived by bootstrapping. Luminous sources tend to have cooler SEDs (i.e., larger FIR fluxes for fixed MIR emission) than less luminous ones.
Other Images in This Article
Show More
Copyright and Terms & Conditions
© 2020. The American Astronomical Society. All rights reserved.
Copyright ©
2025 Astronomy Image Explorer. All Rights Reserved.