Image Details
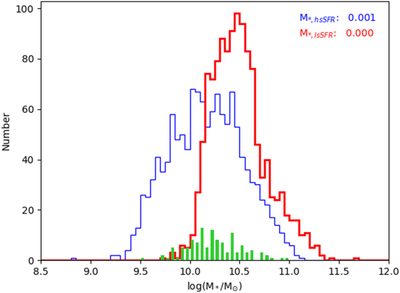
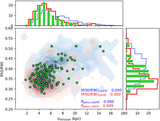
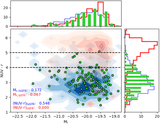
Caption: Figure 3.
Mass histograms of the breakBRD sample in green compared to the high- and low-sSFR parent samples in blue and red, respectively. The p-values from comparing the two parent samples to the breakBRD sample are shown in the figure.
Other Images in This Article
Show More
Copyright and Terms & Conditions
© 2020. The American Astronomical Society.
Copyright ©
2025 Astronomy Image Explorer. All Rights Reserved.