Image Details

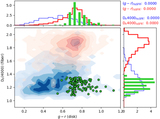
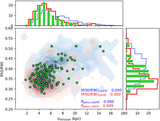
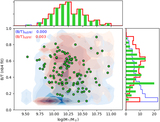
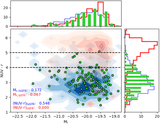
Caption: Figure 10.
Color−stellar mass diagrams comparing the breakBRD sample to the low- and high-sSFR parent sample (colors and symbols as in Figure 1). The top and bottom panels are the g − r and u − r colors, respectively. The black dashed lines denote the “green valley” transitional region (Mendel et al. 2013; Schawinski et al. 2014). Although our galaxies are chosen to have red disks (g − r > 0.655), the total galaxy colors are bluer, indicating star formation in the central regions. In both panels, our sample tends to have transitional or blue colors.
Other Images in This Article
Show More
Copyright and Terms & Conditions
© 2020. The American Astronomical Society.
Copyright ©
2025 Astronomy Image Explorer. All Rights Reserved.