Image Details
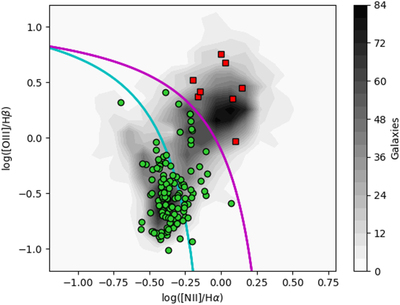
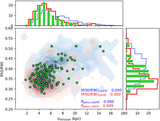
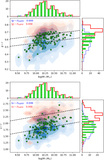
Caption: Figure 2.
Here we use the BPT diagram, used to identify the dominant ionization mechanism in the nebular emission lines of galaxies, to separate out AGNs from composite and star-forming galaxies. The underlying black contours show the distribution of the parent sample. The magenta line and the turquoise line are adopted from Kewley & Dopita (2002) and Kauffmann et al. (2003), respectively, to distinguish between AGN activity above the magenta line, star-forming activity below the turquoise line, and composite activity between the two. The overplotted points show our galaxy sample to be primarily star-forming, with all selected breakBRDs indicated by green circles. Eight galaxies are selected as AGNs (red squares).
Other Images in This Article
Show More
Copyright and Terms & Conditions
© 2020. The American Astronomical Society.