Image Details
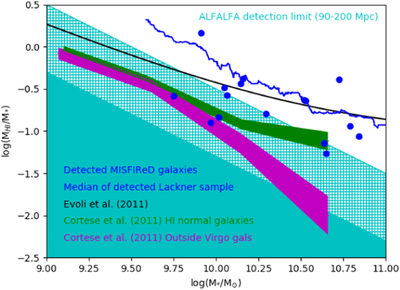
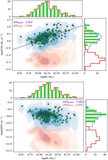
Caption: Figure 15.
Ratio of HI mass to stellar mass as a function of stellar mass for the 16 galaxies with HI detections (blue circles). The blue line is the running mean of the MHI/M* of the parent sample that has HI detections. The black line is the MHI/M* fit from Evoli et al. (2011). The green and magenta regions are the MHI/M* fractions in four mass bins in Cortese et al. (2011). The cyan regions estimate the ALFALFA detection limit starting at a distance of 90 Mpc (hatched region) to 200 Mpc (solid region).
Other Images in This Article
Show More
Copyright and Terms & Conditions
© 2020. The American Astronomical Society.
Copyright ©
2025 Astronomy Image Explorer. All Rights Reserved.