Image Details
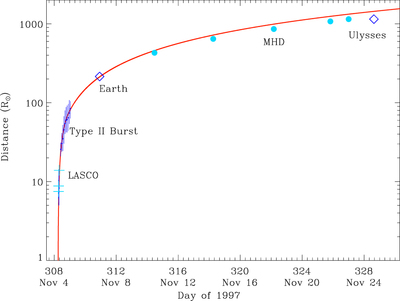
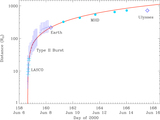
Caption: Figure 5.
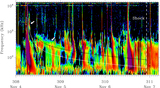
Overall propagation profile of the 1997 November 4 CME-driven shock from the Sun to deep interplanetary space obtained from the analytical model (red curve). Crosses are distances of the CME leading front from the GCS model. Small dots with error bars denote the distances determined from the observed type II burst based on the Leblanc density model (Leblanc et al. 1998). The error bars correspond to the width of the type II band. Diamonds show the distances of the Earth and Ulysses at shock arrival, respectively. Large blue dots indicate the arrival times of the shock at 2, 3, 4, 5, and 5.34 au (Ulysses) predicted by the MHD model.
Other Images in This Article
Show More
Copyright and Terms & Conditions
© 2019. The American Astronomical Society. All rights reserved.