Image Details
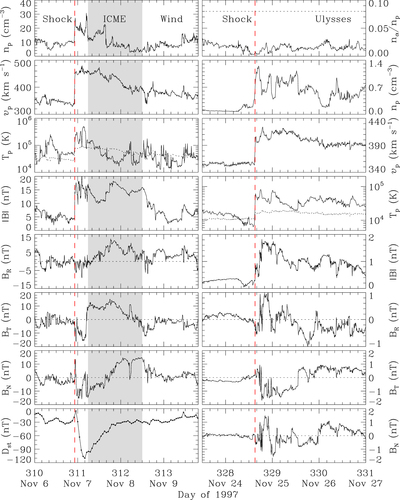
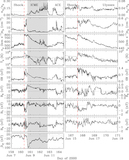
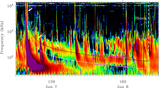
Caption: Figure 2.
Left: solar wind measurements of the 1997 November 4 CME at Wind. From top to bottom, the panels show proton density, bulk speed, proton temperature, magnetic field strength and components, and Dst index, respectively. The dotted curve in the third panel denotes the expected proton temperature obtained from the observed solar wind speed (Lopez 1987). The shaded region marks the interval of the identified ICME. Right: similar to left, but for solar wind measurements at Ulysses. The first panel gives the density ratio between alpha particles and protons, and the horizontal dotted line marks the 0.08 level, which can be used as a threshold for ICMEs (Richardson & Cane 2004; Liu et al. 2005, 2006b). The dotted curve in the fourth panel is the expected proton temperature taking into account the temperature–distance gradient (R−0.7; Gazis et al. 1994). The two red vertical dashed lines indicate the arrival times of the shock at Wind and Ulysses, respectively.
Other Images in This Article
Show More
Copyright and Terms & Conditions
© 2019. The American Astronomical Society. All rights reserved.