Image Details
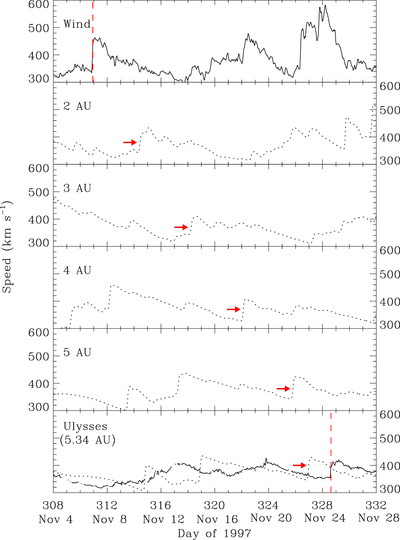
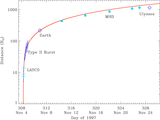
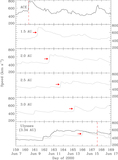
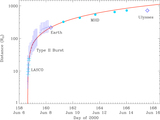
Caption: Figure 3.
Evolution of solar wind speeds from Wind to Ulysses via the 1D MHD model. The solid curves give the solar wind speeds observed at Wind and Ulysses, and the dotted curves represent the predicted speeds at specific distances. The red arrows indicate the progression of the modeled shock. The two red vertical dashed lines mark the observed shock arrival times at Wind and Ulysses, respectively. The same scales are used for all of the panels.
Other Images in This Article
Show More
Copyright and Terms & Conditions
© 2019. The American Astronomical Society. All rights reserved.
Copyright ©
2024 Astronomy Image Explorer. All Rights Reserved.