Image Details
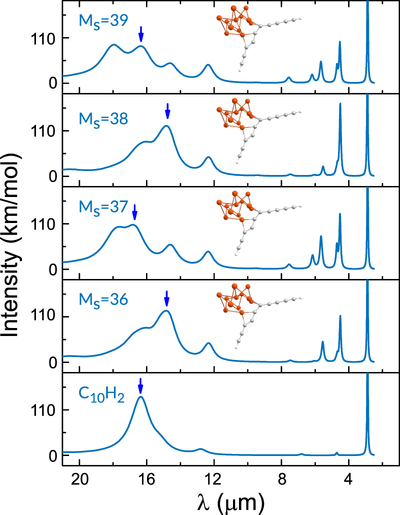
Caption: Figure 9.
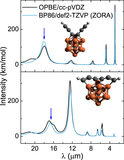
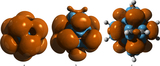
Comparison of the synthetic IR spectra of Fe12–C10H2 (Ms = 37 and 39) with its charged state ﹩{\mathrm{Fe}}_{12}^{+}﹩–C10H2 (Ms = 36 and 38). The optimized structures are shown as insets. Brown spheres correspond to Fe, gray to C, and light gray to H. Blue arrows mark the peaks associated with the IR-active CCH/CCC bending modes. The charged state does not dramatically alter the structures or IR spectra.
Other Images in This Article

Copyright and Terms & Conditions
© 2019. The American Astronomical Society. All rights reserved.
Copyright ©
2025 Astronomy Image Explorer. All Rights Reserved.