Image Details
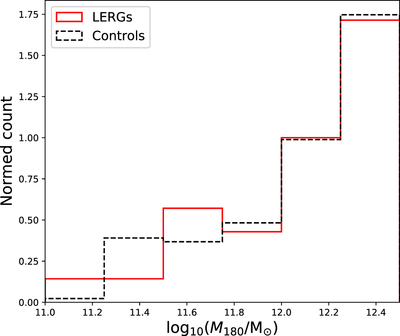
Caption: Figure 7.
Distributions of halo mass estimates for galaxies assigned to groups with M180 < 1012.5 M⊙, and thus treated as field galaxies in our analysis. The red solid line shows the low-mass groups containing LERGs, and the black dashed line the groups containing their control galaxies. Applying a two-sample KS test to these distributions returns p = 0.98, consistent with both distributions being drawn from the same parent population. Halo mass estimates are obtained from the Yang et al. (2007) SDSS group catalog.
Other Images in This Article
Copyright and Terms & Conditions
© 2019. The American Astronomical Society. All rights reserved.
Copyright ©
2025 Astronomy Image Explorer. All Rights Reserved.