Image Details
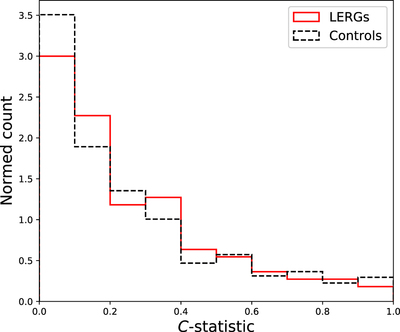
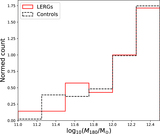
Caption: Figure 2.
Distribution of calculated C-statistic (Smith et al. 2004) values for our selected galaxies assigned membership to large-scale structures, where a lower value is associated with increased likelihood of membership. The red solid line shows the C distribution for the LERG population, and the black dashed line for the control population.
Other Images in This Article
Copyright and Terms & Conditions
© 2019. The American Astronomical Society. All rights reserved.
Copyright ©
2025 Astronomy Image Explorer. All Rights Reserved.