Image Details
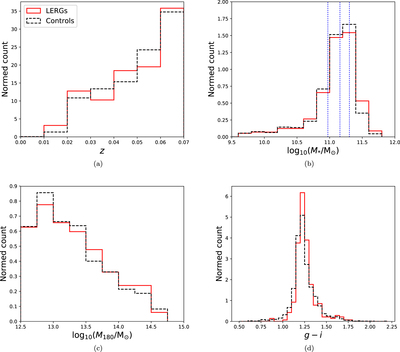
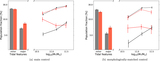
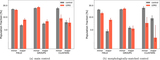
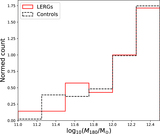
Caption: Figure 3.
Similar distributions of (a) redshift, (b) stellar mass, (c) group halo masses, and (d) g − i colors of the LERG and control samples. The red solid line represents LERGs and the black dashed line represents the control population. The blue dotted lines shown in panel (b) highlight the 25th, 50th, and 75th percentiles of the LERG stellar mass distribution, used for mass subsetting in our analysis.
Other Images in This Article
Copyright and Terms & Conditions
© 2019. The American Astronomical Society. All rights reserved.
Copyright ©
2025 Astronomy Image Explorer. All Rights Reserved.