Image Details
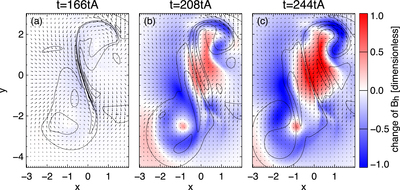
Caption: Figure 4.
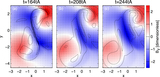
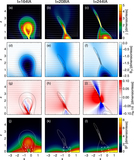
Magnitude of the horizontal magnetic field changes at three different times during the eruption. The change in absolute value of the horizontal magnetic field ﹩\delta {B}_{h}(z=0.1)﹩ is defined by the color code. The arrows are the same as in Figure 3. The solid contour lines mark the electric current density at levels ﹩{j}_{z}(z=0.1)=-2.2,﹩ −0.4, 1.6, and 2.7 (see jz maps in Figure 3). The animation begins at ﹩t=164{t}_{A}﹩ and ends at ﹩t=244{t}_{A}﹩.
(An animation of this figure is available.)
The video/animation of this figure is available in the online journal.
Other Images in This Article
Copyright and Terms & Conditions
© 2019. The American Astronomical Society. All rights reserved.
Copyright ©
2025 Astronomy Image Explorer. All Rights Reserved.