Image Details
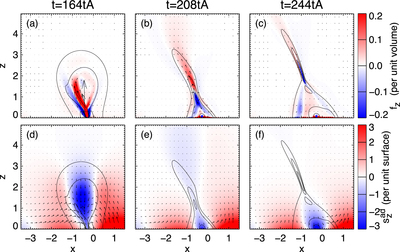
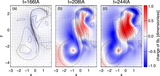
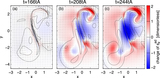
Caption: Figure 10.
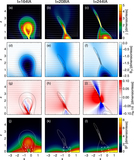
Comparison of the Lorentz force density fz (a)–(c) and the alternative Lorentz force density ﹩{s}_{z}^{\mathrm{ad}}﹩ (d)–(f) at three different times during the eruption phase, viewed along a vertical cut at y = 0. The vertical component is presented in the color scale. Vectors indicate fx, fz (panels (a)–(c)) and ﹩{s}_{x}^{\mathrm{ad}}﹩, ﹩{s}_{z}^{\mathrm{ad}}﹩ (panels (d)–(f)). Vectors fx, fz are multiplied by a factor of 5. The black contour lines mark the current density at levels ﹩| {\boldsymbol{j}}| =1.1﹩, 3.0, and 6.0 (see Figure 11) and show an inverted Y-shape. All units are dimensionless. The animation begins at ﹩t=164{t}_{A}﹩ and ends at ﹩t=244{t}_{A}﹩.
(An animation of this figure is available.)
The video/animation of this figure is available in the online journal.
Other Images in This Article
Copyright and Terms & Conditions
© 2019. The American Astronomical Society. All rights reserved.