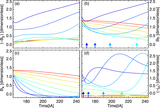
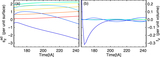
Image Details
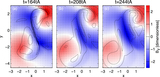
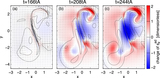
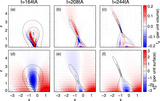
Caption: Figure 1.
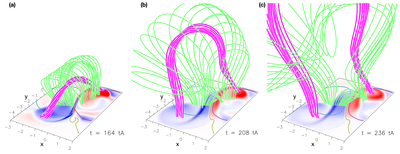
Three-dimensional plots of the coronal magnetic field line evolution showing the underlying photospheric currents. The snapshots presents a projected views of the flare simulation before reconnection (﹩t=164{t}_{{\rm{A}}}﹩), during the eruption (﹩t=208{t}_{{\rm{A}}}﹩), and at a later time (﹩t=236{t}_{{\rm{A}}}﹩). The blue and red color scale images indicate the negative and positive component of the vertical current density jz. Colors are consistent with the currents presented in the next figures. Light blue and purple contours define the two opposite-polarity magnetic field patches at the photosphere. The PIL is highlighted in olive. The magenta line shows the magnetic flux rope that is rooted within the hook created by the current ribbons. The bright green lines present the overlying arcade.
Other Images in This Article
Copyright and Terms & Conditions
© 2019. The American Astronomical Society. All rights reserved.