Image Details
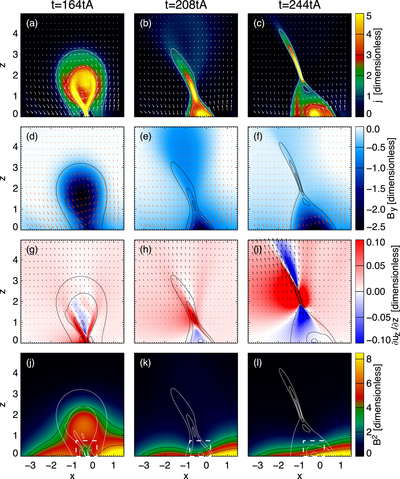
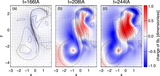
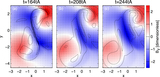
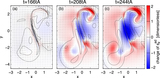
Caption: Figure 11.
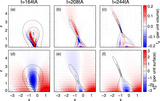
Evolution of the eruptive event in different observables, viewed in the (x, z) plane at y = 0. The temporal evolution of the magnitude of the current density (a)–(c) is presented by the color scale. Contours (white: a–c, j–l; black: d–i) are at thresholds ﹩| {\boldsymbol{j}}| =1.1﹩, 3.0, and 6.0 and identify the inverted Y-shape. Arrows mark the Bx and Bz components of the magnetic field (a)–(f). The temporal evolution of By (d)–(f), defined by the blue-to-white color scale, is almost unipolar. The velocity derivative ﹩\partial {u}_{z}/\partial z﹩ (g)–(i) shows a clear change of sign in the inverted Y-shaped structure. The velocity components ux, uz are indicated by arrows (g)–(i). The temporal evolution of the magnetic field energy density (j)–(l) is presented by the color scale. Contours (black: (j)–(l)) are at thresholds B2 = 3.0, 4.0, and 6.5. The dashed line box (j)–(l) marks the region of the increased magnetic energy density within the volume of the cusp that contains the flare loops (compare k and l). The animation begins at ﹩t=164{t}_{A}﹩ and ends at ﹩t=244{t}_{A}﹩.
(An animation of this figure is available.)
The video/animation of this figure is available in the online journal.
Other Images in This Article
Copyright and Terms & Conditions
© 2019. The American Astronomical Society. All rights reserved.