Image Details
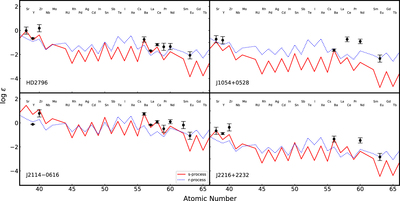
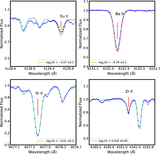
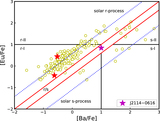
Caption: Figure 12.
Abundance patterns for the neutron-capture elements in our sample. The solid line represents the solar system s-process abundance pattern from Burris et al. (2000), scaled to match the observed abundance of Ba in each star. The dotted line represents the solar system r-process abundance pattern from Burris et al. (2000), scaled to match the observed abundance of Eu in each star. Note that we only include these stars with measured Ba and Eu.
Other Images in This Article
Show More
Copyright and Terms & Conditions
© 2019. The American Astronomical Society. All rights reserved.
Copyright ©
2025 Astronomy Image Explorer. All Rights Reserved.