Image Details
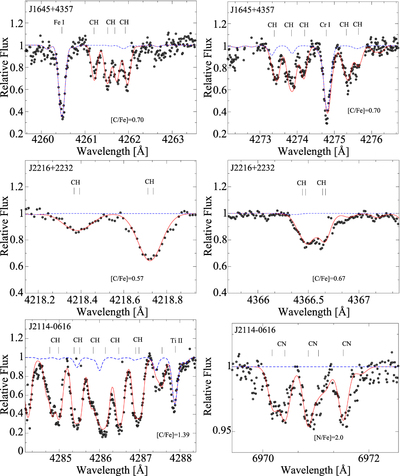
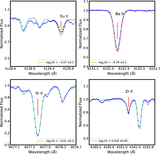
Caption: Figure 3.
Portions of the Lick/APF spectra near the CH and CN bands (represented as black filled circles). Best fit of the selected CH and CN are also shown (red solid line). The dashed lines show the synthetic spectrum with no carbon in the atmosphere.
Other Images in This Article
Show More
Copyright and Terms & Conditions
© 2019. The American Astronomical Society. All rights reserved.
Copyright ©
2025 Astronomy Image Explorer. All Rights Reserved.