Image Details
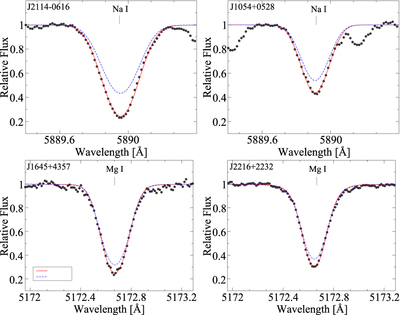
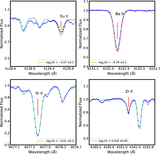
Caption: Figure 4.
An example of the NLTE fittings of Na and Mg in Lick/APF spectra. The observed spectra are shown by filled circles; for comparison, the LTE profiles computed with the corresponding NLTE abundances are shown by the blue dashed curves.
Other Images in This Article
Show More
Copyright and Terms & Conditions
© 2019. The American Astronomical Society. All rights reserved.
Copyright ©
2025 Astronomy Image Explorer. All Rights Reserved.