Image Details
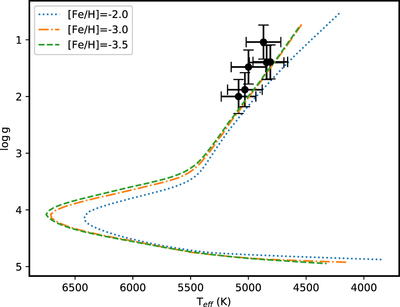
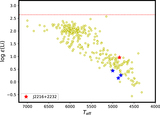
Caption: Figure 2.
Our sample shown in an H-R-Diagram, based on the ﹩{T}_{\mathrm{eff}}﹩ and ﹩\mathrm{log}\,g﹩ determined from the LIKC/APF spectra (see Table 3). Yale-Yonsei 12 ﹩\mathrm{Gyr}﹩ isochrones with [α/Fe] = +0.4 and [Fe/H] = −2.5, −3.0, and −3.5 from Demarque et al. (2004) overplotted as reference.
Other Images in This Article
Show More
Copyright and Terms & Conditions
© 2019. The American Astronomical Society. All rights reserved.
Copyright ©
2025 Astronomy Image Explorer. All Rights Reserved.