Image Details
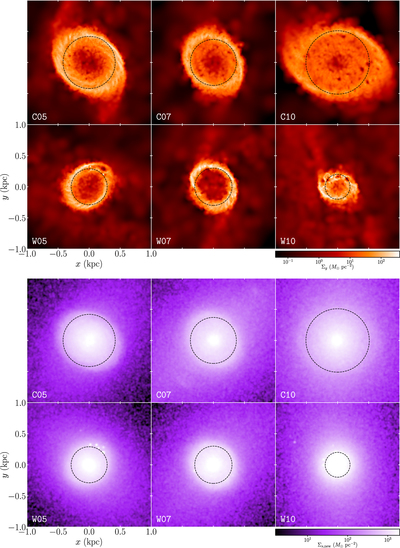
Caption: Figure 18.
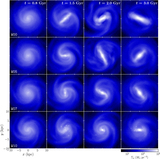
Snapshots of the logarithm of the gas surface density (upper panels) and the surface density of the newly formed stars (lower panels) at ﹩t=5\,\mathrm{Gyr}﹩ in the 1 kpc regions for all models with gas. The dashed circle in each panel draws the ring size calculated from Equation (11).
Other Images in This Article
Show More
Copyright and Terms & Conditions
© 2019. The American Astronomical Society. All rights reserved.
Copyright ©
2026 Astronomy Image Explorer. All Rights Reserved.