Image Details
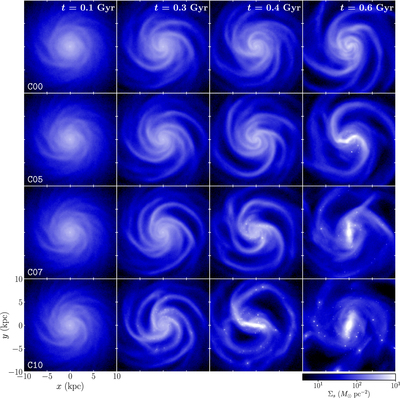
Caption: Figure 2.
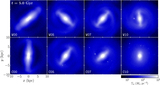
Snapshots of the logarithm of the stellar surface density ﹩{{\rm{\Sigma }}}_{s}﹩ for cold-disk models at t = 0.1, 0.3, 0.4, and 0.6 Gyr from left to right. Each row corresponds to a model with ﹩{f}_{\mathrm{gas}}=0 \% ﹩, 5%, 7%, and 10% from top to bottom. Discrete bright spots represent newly formed stars from the gas disk, while smooth color distributions display the stellar particles in the initial disk. The color bar labels ﹩{{\rm{\Sigma }}}_{s}/({M}_{\odot }\,{\mathrm{pc}}^{-2})﹩.
Other Images in This Article
Show More
Copyright and Terms & Conditions
© 2019. The American Astronomical Society. All rights reserved.
Copyright ©
2026 Astronomy Image Explorer. All Rights Reserved.