Image Details
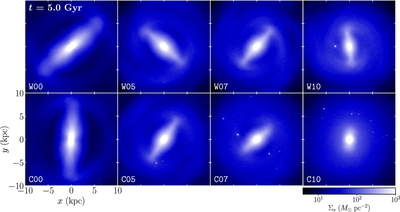
Caption: Figure 7.
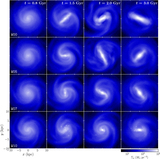
Snapshots of the logarithm of the stellar surface density in the ﹩10\,\mathrm{kpc}﹩ regions for all models at ﹩t=5\,\mathrm{Gyr}﹩. The color bar labels ﹩{{\rm{\Sigma }}}_{s}/({M}_{\odot }\,{\mathrm{pc}}^{-2})﹩.
Other Images in This Article
Show More
Copyright and Terms & Conditions
© 2019. The American Astronomical Society. All rights reserved.
Copyright ©
2026 Astronomy Image Explorer. All Rights Reserved.