Image Details
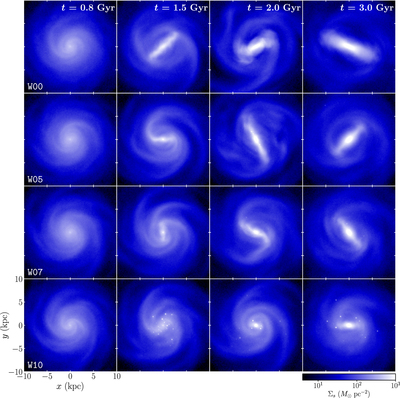
Caption: Figure 4.
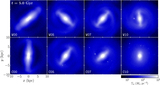
Snapshots of the logarithm of the stellar surface density ﹩{{\rm{\Sigma }}}_{s}﹩ for the warm-disk models at t = 0.8, 1.5, 2.0, and 3.0 Gyr from left to right. Each row corresponds to a model with ﹩{f}_{\mathrm{gas}}=0 \% ﹩, 5%, 7%, and 10% from top to bottom. The color bar labels ﹩{{\rm{\Sigma }}}_{s}/({M}_{\odot }\,{\mathrm{pc}}^{-2})﹩.
Other Images in This Article
Show More
Copyright and Terms & Conditions
© 2019. The American Astronomical Society. All rights reserved.
Copyright ©
2026 Astronomy Image Explorer. All Rights Reserved.