Image Details
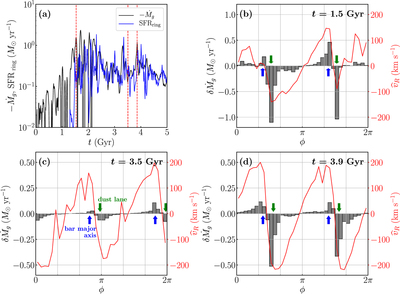
Caption: Figure 16.
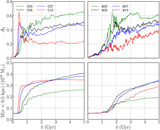
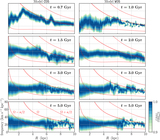
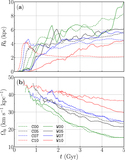
(a) Temporal variations in gas inflow rate ﹩-{\dot{M}}_{g}﹩ measured at ﹩R=1\,\mathrm{kpc}﹩ (black), compared with the ring star formation rate SFR﹩{}_{\mathrm{ring}}﹩ (blue) for model W05. (b)–(d) Angular distributions of the gas inflow rates ﹩\delta {\dot{M}}_{g}﹩ in an azimuthal bin with size ﹩\delta \phi =10^\circ ﹩ (histograms; left axis) and the density-weighted radial gas velocity ﹩{\widehat{v}}_{R}(R=0.5\,\mathrm{kpc})﹩ (red line; right axis) at t = 1.5, 3.5, and 3.9 Gyr of model W05, which are marked as dashed vertical lines in (a). The blue and green arrows indicate the locations of the bar semimajor axis and the dust lanes, respectively.
Other Images in This Article
Show More
Copyright and Terms & Conditions
© 2019. The American Astronomical Society. All rights reserved.