Image Details
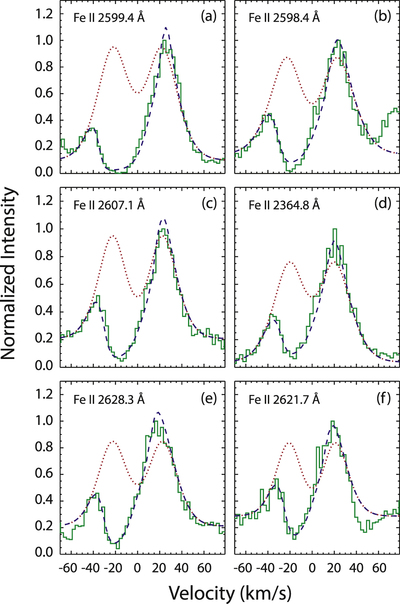
Caption: Figure 5.
Sample of SEI fits to lines representing a wide range of optical depths in the spectra of γ Cru. The full green line shows the GHRS observed spectrum; the red dotted line is the chromospheric profile input to the base of the wind; and the blue dashed line is the calculated profile.
Other Images in This Article


Copyright and Terms & Conditions
© 2018. The American Astronomical Society. All rights reserved.
Copyright ©
2025 Astronomy Image Explorer. All Rights Reserved.