Image Details

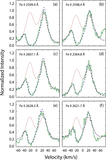
Caption: Figure 4.
Sample of SEI fits to lines representing a wide range of optical depths in the spectra of μ Gem. The full green line shows the GHRS observed spectrum; the red dotted line is the chromospheric profile input to the base of the wind; the blue dashed line is the calculated profile. The two dark vertical lines over the Mg II profiles at 2795.5 Å (panel e) and 2802.7 Å (panel f) underline two interstellar features (see Table 4).
Other Images in This Article


Copyright and Terms & Conditions
© 2018. The American Astronomical Society. All rights reserved.
Copyright ©
2025 Astronomy Image Explorer. All Rights Reserved.