Image Details
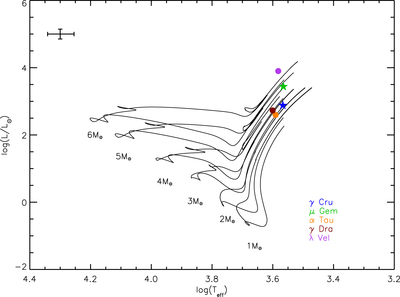
Caption: Figure 1.
Hertzsprung–Russell diagram with evolutionary tracks from Marigo et al. (2013) for various stellar masses. Different colors indicate the location in the diagram of the various stars. γ Cru (⋆) and μ Gem (⋆), while the filled circles represent the comparison stars for the earlier papers in this program. A typical error bar is shown in the upper left side of the figure.
Other Images in This Article


Copyright and Terms & Conditions
© 2018. The American Astronomical Society. All rights reserved.
Copyright ©
2025 Astronomy Image Explorer. All Rights Reserved.